Map basics
How to read a drainage map: contour lines, high ground, and where water goes
You don’t need to be a surveyor to read the land around a property. Three simple ideas (contour lines, high and low ground, and which way is downhill) explain most of what a drainage map shows.
Before you start: what a drainage map is, and isn’t. Terreflow’s Surface Drainage map shows where the shape of the ground would send rainwater. It is not a flood map or a flood forecast. It doesn’t know how much rain falls, how deep water gets, how fast it moves, or what storm drains, ditches, culverts, ponds and levees do with it. It does not replace the official FEMA flood map, a survey, or advice from a licensed professional.
Water runs downhill, straight across contour lines, and gathers in valleys and low spots. On a contour map, lines close together mean steep ground, rings mean a hilltop or a hollow, and lines that bend into a V point uphill along a valley. On Terreflow’s Surface Drainage view, gray is high ground that sheds water, deeper blue means more land drains through that spot, and the standing-water shading marks closed low spots.
Contour lines in one minute
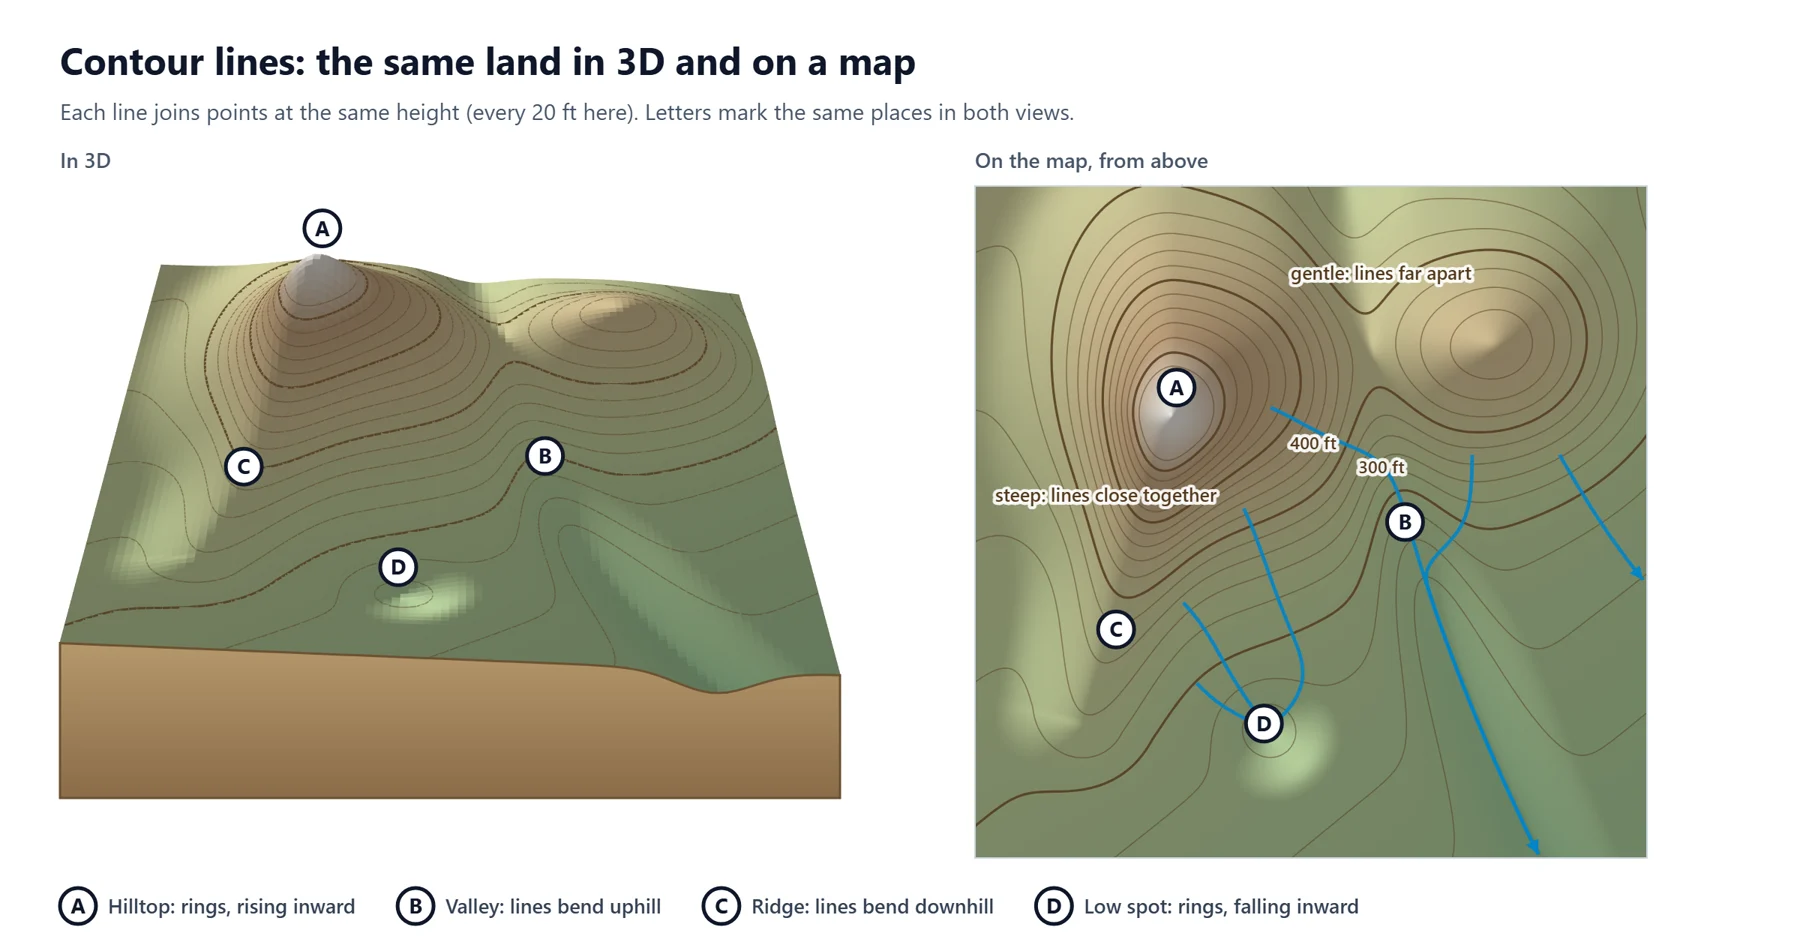
A contour line joins points that are at the same height. Imagine slicing a hill horizontally every 20 feet and looking down from above: each slice leaves a line, and together they show the shape of the land on a flat map.
- The contour interval is the height difference between neighboring lines, such as 20 feet or 2 meters. It’s usually printed on the map.
- Heavier, labeled lines (index contours) make it easier to count. Their numbers tell you which way is up.
- Spacing tells you steepness. Lines packed close together mean steep ground; lines far apart mean gentle or nearly flat ground.
Spotting high and low ground
- Hilltop (A): a set of closed rings with the numbers rising toward the middle.
- Valley (B): the lines bend into a V or U that points uphill. Streams and runoff follow the bottom of that V.
- Ridge (C): the lines bend into a V or U that points downhill. Water runs off both sides of it.
- Low spot (D): a closed ring whose inside is lower, a hollow with no way out. Printed USGS topographic maps mark these “depression contours” with small tick marks pointing into the hollow.
When in doubt, follow the numbers: find two labeled lines and see which way the values rise.
Which way water goes
- Straight downhill, across the lines. Water takes the steepest way down, which crosses contour lines at right angles.
- Into the valleys. Runoff from the slopes on both sides gathers in the bottom of each V, so valleys carry more water than the slopes above them.
- The more land uphill, the more water. Everything that drains to a spot is its drainage area. A small dip at the bottom of a long slope can receive far more water in a storm than its size suggests.
- Low spots fill, then overflow. Water collects in a hollow until it reaches the lowest point of the rim, then spills on downhill.
Where the ground is nearly flat, which is common on coastal plains, the lines are far apart and the downhill direction is hard to read, for people and for computers alike.
Reading Terreflow’s map
Terreflow puts these ideas on a 3D map of the area around an address. The question mark (?) button on the map has a short version of this guide.
The Elevation tab
- Colors show height: green for lower ground, tan and brown in between, white for the highest points. The scale adjusts to the area you’re viewing, so small differences stand out.
- Contour lines can be turned on or off. The interval adapts to the terrain and is shown in feet or meters (use the ft/m switch).
- The point you searched is marked on the map, and its elevation and a plain-English summary appear beside it.
- The vertical profile is a cross-section through your point, west to east or south to north, with a red star marking the spot. It’s the quickest way to see whether a lot sits lower than the land on either side.
The 3D view
Tilt and rotate the map to see the land from any side: on a computer, right-click and drag (or hold Ctrl and drag); on a phone, use two fingers. Heights are exaggerated 4 times by default so that gentle slopes are visible. The slider changes this from 1× (true scale) to 10×. Keep in mind that exaggeration makes hills look much steeper than they are.
The Surface Drainage tab
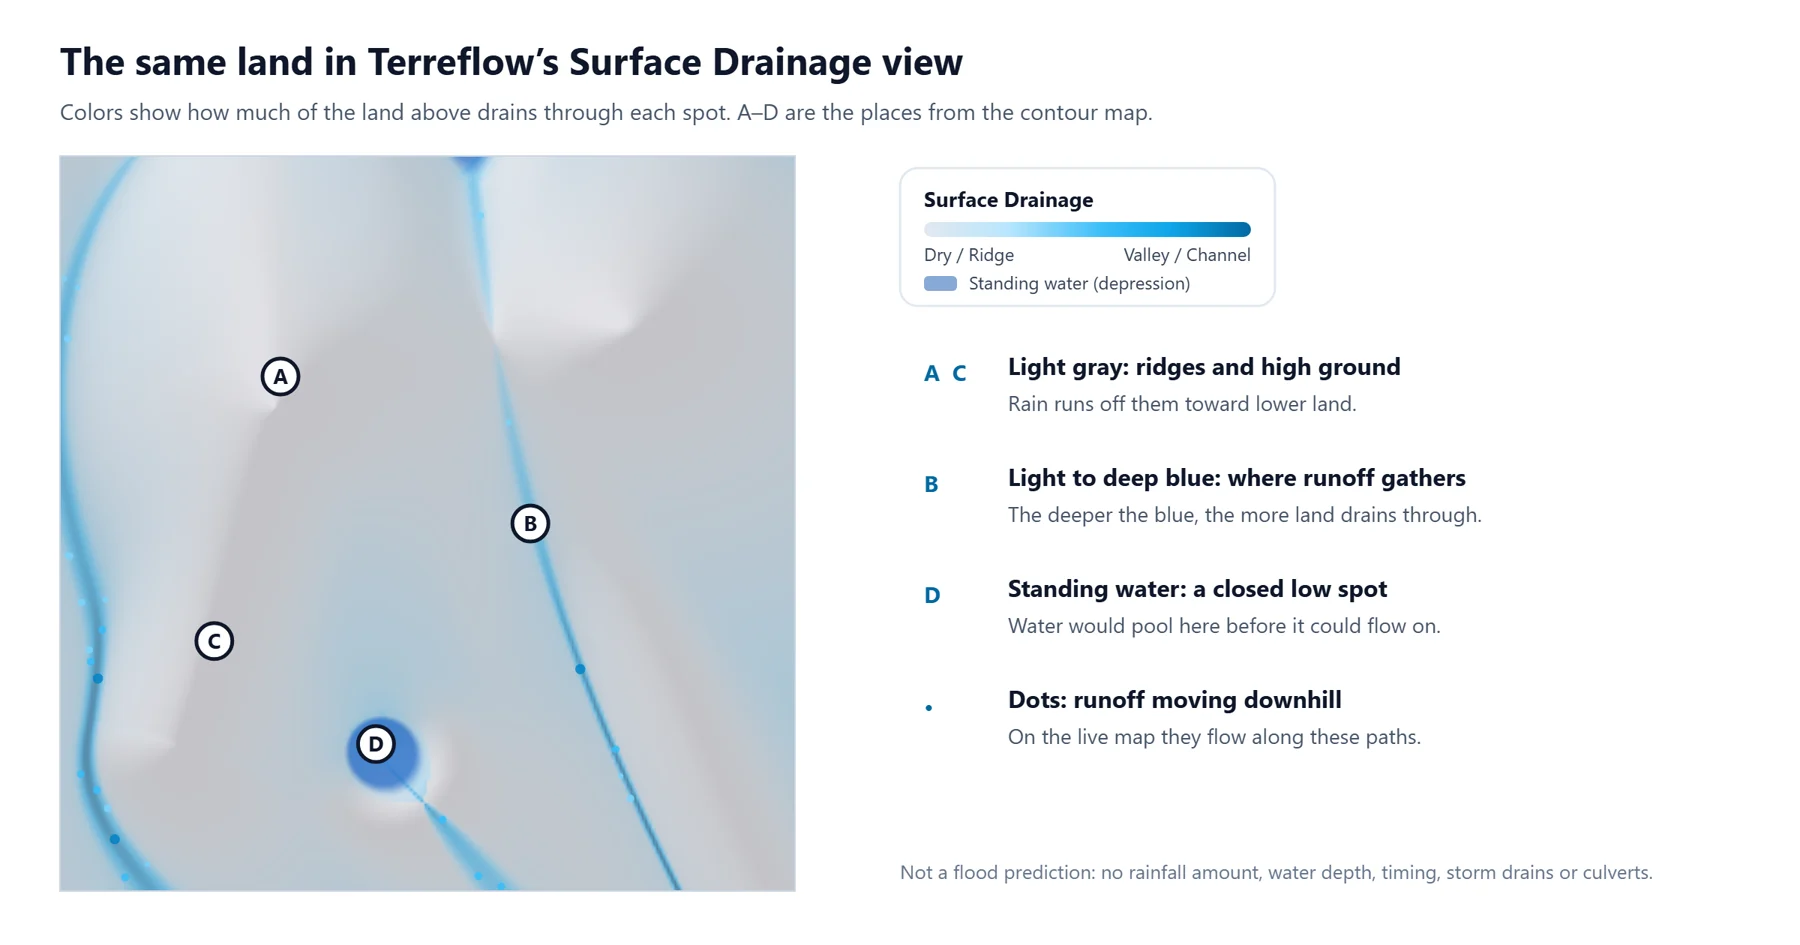
- Light gray is high ground and ridges. Rain runs off them toward lower land.
- Light to deep blue shows how much of the land uphill drains through each spot. The deepest blue marks valleys and channels, the main paths runoff takes.
- Standing water (depression) marks closed low spots, at least about a foot deep in the elevation data, where water would pool before it could flow on.
- Moving dots follow the downhill paths; they are larger and darker where more water gathers. On most devices, light also moves through the blue in the direction of flow.
The map covers roughly 9 miles (14 km) square around the address, split into cells about 250 feet (76 m) across. On phones and tablets it covers about 6 miles (10 km) square with cells about 300 feet (91 m) across. It is calculated in your browser from public elevation data (USGS 3DEP, via Mapbox), and the result stays the same when you zoom in or out.
The FEMA flood zone is a separate layer on the Hazards tab. See Is my house in a flood zone? for how to read it.
What the map can’t tell you
Read the drainage map as one clue about how the land is shaped, never as the answer to whether a property will flood.
- It is not a flood forecast or a flood risk rating. It has no rainfall amounts, water depths, speeds or timing, and it doesn’t estimate the chance of flooding.
- It doesn’t see engineered drainage. Storm drains, pipes, culverts under roads, ditches, curbs, detention ponds, pumps and levees can move water very differently from the bare ground.
- It can’t see small features. Each cell is about 250 feet across, so a swale, a driveway, a raised house pad or the grading around a foundation is smaller than one cell. Neighboring houses can fall in the same cell.
- The ground may have changed. Elevation data can predate new construction, fill or regrading.
- Flat land is uncertain. Where the ground is nearly level, small errors in the data can change which way water appears to go.
- Soil and surfaces aren’t included. The map shows where water would run over the surface, not how much soaks into the soil or runs off pavement and roofs.
- Blue doesn’t mean “will flood,” and gray doesn’t mean “safe.” A house on gray high ground can still have water problems, and many homes near blue paths never flood.
For any decision about buying, building or insuring, check the official FEMA flood map, ask about the property’s flood history, visit during or after heavy rain, and consult a licensed surveyor, civil engineer or your local floodplain administrator.
A five-minute routine for any address
- Elevation tab: find the lot and look at the profile. Is it higher or lower than the land around it?
- Contours on: do any V-shaped bends point toward the lot? Is it inside a ring?
- Surface Drainage tab: is the lot on or next to a blue path or a standing-water area? Which way do the dots go?
- Hazards tab: note the FEMA flood zone.
- Then go further: work through the terrain checklist, ask whether the house has flooded before, and see it in the rain.
Try it on an address
Elevation, contour lines, surface drainage and the FEMA flood zone, together on one 3D map.
Open the map →Terreflow’s surface drainage modeling is based solely on digital elevation data and shows where terrain shape directs rainwater. It does not predict flooding, estimate water depths or assess flood risk, and it does not capture engineered features such as storm drains, detention ponds, levees, diverted channels or elevated building pads. The figures in this guide show an invented landscape for illustration. Do not rely on this information alone for a purchase, insurance, flood risk or development decision.
Sources
- U.S. Geological Survey, Topographic Map Symbols (contour lines, index contours and depression contours)
- U.S. Geological Survey, 3D Elevation Program (3DEP)
- FEMA, Flood Map Service Center