Flood zones
Is my house in a flood zone? How to check, and why Zone X can still flood
A flood zone takes a few minutes to look up, and it decides whether your lender requires flood insurance. What it doesn’t tell you is whether the house will stay dry. Here is how to read it, and what to check beyond it.
Enter the address in our free flood zone lookup or on FEMA’s Flood Map Service Center. Zones that start with A or V are high-risk areas, where a federally backed mortgage requires flood insurance. Zone X (also shown as B or C on older maps) means moderate or low risk from the rivers and coasts FEMA studied, not no risk: in the 20 flood-prone counties we analyzed, one in three flood insurance claims came from these zones. Nationally, FEMA puts it at 29%.
How to look up a flood zone
- FEMA Flood Map Service Center (MSC). Go to msc.fema.gov, type the address, and open the interactive map or download a FIRMette, a printable excerpt of the official Flood Insurance Rate Map (FIRM). Note the map’s effective date; some areas still use maps that are decades old. If the area has preliminary maps, look at them too: they don’t set requirements yet, but they show where the zone is likely headed.
- National Flood Hazard Layer (NFHL) viewer. FEMA’s NFHL viewer shows the same digital flood zones on a zoomable map, which helps when a property sits near a zone boundary.
- Terreflow. The free flood zone lookup gives the zone and ground elevation for an address. On the 3D map, the Surface Drainage tab shows how the terrain around it moves water, which the flood zone does not cover.
When you take out a mortgage, the lender orders its own flood zone determination for the building. If you want to know before you make an offer, look it up yourself.
What each flood zone means
Zones beginning with A or V make up the Special Flood Hazard Area (SFHA): land expected to be flooded by the 1%-annual-chance flood, often called the “100-year flood.”
| Zone | What it means |
|---|---|
| A | High risk (1% annual chance). No detailed study, so no Base Flood Elevation is published. |
| AE | High risk, with a Base Flood Elevation (BFE): the height the 1%-annual-chance flood is expected to reach. |
| AH, AO | High risk of shallow flooding, usually 1 to 3 feet: ponding (AH) or sheet flow on sloping ground (AO). |
| AR, A99 | High risk in areas behind a flood-control system that is being restored (AR) or still under construction (A99). |
| V, VE | Coastal high-hazard areas, with storm waves on top of the flood. VE has a published BFE. |
| X (shaded), B | Moderate risk: between the 1% and 0.2%-annual-chance (“500-year”) flood limits, or areas protected by levees from the 1% flood. |
| X (unshaded), C | Minimal risk from the flooding sources FEMA studied: outside the 0.2%-annual-chance floodplain. |
| D | Possible but undetermined flood hazard; the area has not been studied. |
Inside the SFHA, in communities that take part in the National Flood Insurance Program, flood insurance is mandatory for a building with a mortgage from a federally regulated or insured lender, from a federal agency (FHA, VA or USDA loans), or sold to Fannie Mae or Freddie Mac. Outside it, flood insurance is optional, and most owners don’t buy it.
What “1% annual chance” really means
A “100-year flood” is not a flood that comes once a century. It is a flood with a 1% chance of happening in any given year, every year. Over a 30-year mortgage, that adds up to about a 26% chance of at least one such flood, slightly more than one in four. FEMA uses the same figure.
Why Zone X can still flood
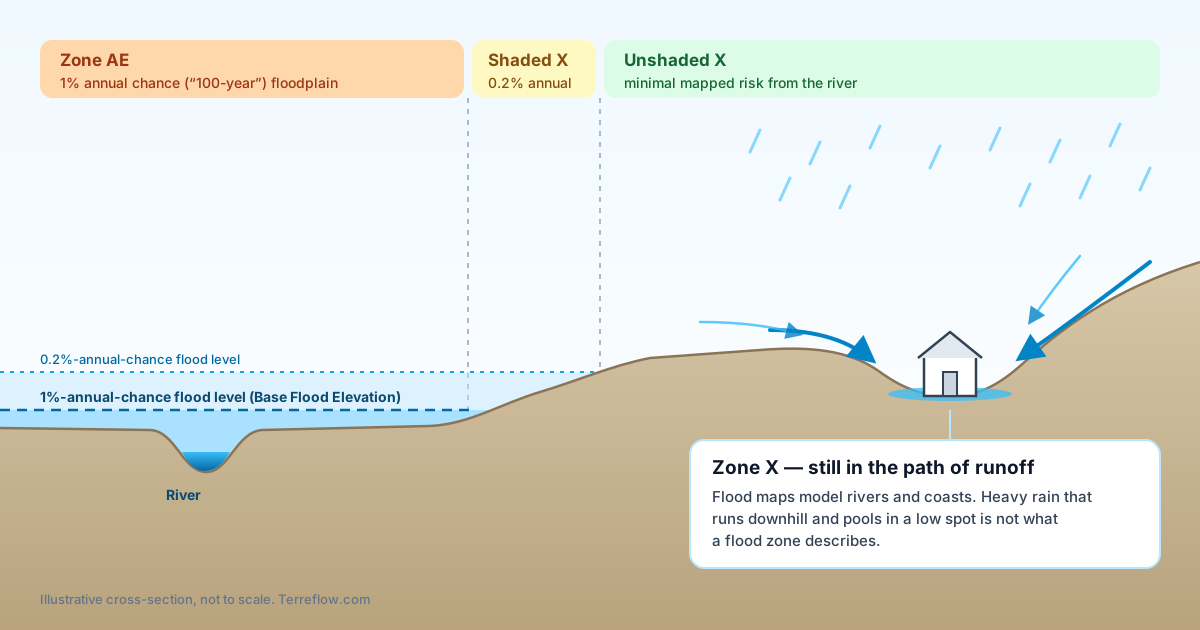
- Flood maps model rivers and coasts, not every rainstorm. A FIRM shows where an overflowing river, lake or sea is expected to reach. Intense rain that runs downhill, fills low spots or overwhelms storm drains can flood homes far from any mapped floodplain. A 2021 federal audit (GAO) found that FEMA’s maps do not reflect hazards such as heavy rainfall.
- Small drainage paths are often not studied. FEMA has generally treated flooding from areas draining less than about one square mile as a local drainage problem. Minor creeks, swales and roadside ditches may have no mapped floodplain at all, even when they carry a lot of water in a downpour.
- The land changes after the map is drawn. New roofs, roads and parking lots send more water downhill, faster. A map’s effective date tells you how old its picture is.
- Storms can exceed the 1% flood. The SFHA is drawn for one level of flood. Larger events, like Hurricane Harvey’s rainfall around Houston in 2017, flood well beyond it.
- Boundaries are approximate. A house just outside a zone line is at nearly the same risk as one just inside it.
What the claims data shows
FEMA publishes every National Flood Insurance Program (NFIP) claim since 1978, without names or street addresses, through OpenFEMA. We counted, for the 20 counties covered by our county drainage maps, how many claims came from buildings rated in the moderate- and low-risk zones (X, B and C).
Across all 20 counties, 234,657 of 714,120 claims (33%) came from those zones. Around Houston, it was more than half. That is in line with FEMA’s national figure: from 2014 to 2024, nearly a third of NFIP claims (29%) came from outside current high-risk areas.
| County | NFIP claims with a rated zone | In Zone X, B or C | Share |
|---|---|---|---|
| Fort Bend County, TX | 7,158 | 5,181 | 72% |
| Harris County, TX | 167,357 | 91,764 | 55% |
| Montgomery County, TX | 11,418 | 6,184 | 54% |
| Palm Beach County, FL | 10,440 | 5,213 | 50% |
| Brazoria County, TX | 20,316 | 9,145 | 45% |
| Maricopa County, AZ | 2,172 | 962 | 44% |
| St. Louis city, MO | 646 | 220 | 34% |
| Cook County, IL | 14,556 | 4,539 | 31% |
| Galveston County, TX | 60,548 | 18,554 | 31% |
| Jefferson Parish, LA | 134,772 | 39,426 | 29% |
| King County, WA | 3,304 | 907 | 27% |
| Orleans Parish, LA | 125,270 | 31,811 | 25% |
| Hamilton County, OH | 1,481 | 375 | 25% |
| Buncombe County, NC | 1,170 | 295 | 25% |
| Sacramento County, CA | 3,820 | 930 | 24% |
| Horry County, SC | 12,429 | 2,843 | 23% |
| East Baton Rouge Parish, LA | 22,094 | 4,667 | 21% |
| Charleston County, SC | 19,238 | 2,307 | 12% |
| Broward County, FL | 34,475 | 3,906 | 11% |
| Miami-Dade County, FL | 61,456 | 5,428 | 9% |
How to read this. Counts are NFIP claims from 1978 on, from OpenFEMA’s NFIP Redacted Claims (v3) as retrieved on October 8, 2026, excluding claims with no rated zone. The “rated” zone is the one used to price the policy, which can come from an older map. Areas behind levees, common around New Orleans, are often mapped as Zone X. And because few owners outside high-risk zones carry flood insurance, these claims likely undercount how often those zones flood.
What to do next
If the house is in Zone X
- Look at the terrain. Is the lot lower than the street and its neighbors? Does a drainage path cross it? Our terrain checklist walks through what to look for.
- Ask about past flooding. See how to check whether a house has flooded before.
- Get a flood insurance quote. Since 2021, NFIP prices each building on its own flood risk (distance to water, elevation, rebuild cost and more) rather than its zone alone. NFIP policies usually take 30 days to take effect, so don’t wait for a storm in the forecast.
If the house is in a high-risk zone (A or V)
- Ask for the Elevation Certificate. It records the building’s elevation relative to the Base Flood Elevation, which affects both risk and insurance cost. It is completed by a licensed surveyor, engineer or architect.
- Check whether the building sits above the BFE. If the structure is on natural high ground above the BFE, the owner can ask FEMA for a Letter of Map Amendment (LOMA), which removes it from the SFHA and the mandatory insurance requirement.
- Budget for flood insurance. It is required for most mortgages in these zones, and the Elevation Certificate and the building’s features can change the price considerably.
See the flood zone and the terrain together
Terreflow shows an address’s FEMA flood zone next to a terrain drainage map, so you can see whether a Zone X lot sits in the path of runoff.
Analyze an address →Sources
- FEMA, Flood Map Service Center and National Flood Hazard Layer viewer
- FEMA, Flood zones
- FEMA, OpenFEMA: NFIP Redacted Claims (v3), retrieved October 8, 2026
- FloodSmart (NFIP), What is my flood risk? (29% of claims from outside high-risk areas, 2014–2024)
- U.S. Government Accountability Office, GAO-22-104079: FEMA flood maps (2021)
- FEMA, NFIP pricing (Risk Rating 2.0)
- FEMA, Letter of Map Amendment (LOMA)