Natural hazards
FEMA’s National Risk Index: what a rating means for a home, and why one number can mislead
FEMA rates every U.S. county and neighborhood from Very Low to Very High for 18 natural hazards. The ratings are good for comparing places, and easy to misread for a single house.
A National Risk Index rating compares areas, not houses. It says how a census tract (a neighborhood of about 4,000 people) or a county ranks against all others in the country for the losses a hazard is expected to cause each year, adjusted for how well the community can cope. It isn’t a forecast and it isn’t a score for one home. Use it to see which hazards matter in an area, then check the house itself.
A Very Low rating doesn’t mean a home is safe! FEMA says plainly that a hazard can still strike a low-rated area.
What the rating measures
For each hazard, FEMA starts with three plain questions: how often does it happen here, what’s in its way (buildings, people, crops), and how much damage did past events do? Multiplied together they give the expected yearly loss, an average in dollars.
FEMA then adjusts that number by a community risk factor: it goes up where people are more vulnerable (for example, fewer resources to prepare or recover) and where the community is less resilient. Finally every tract is ranked against every other tract in the country, and every county against every county.
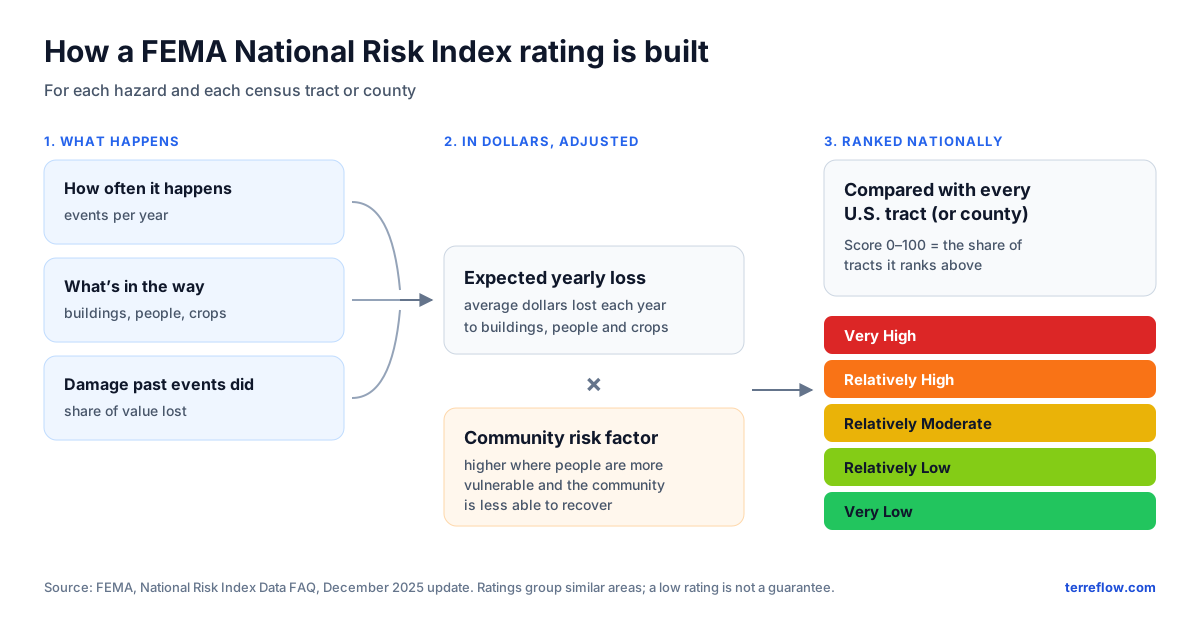
- The score (0 to 100) is a percentile: a score of 70 means the area ranks above about 70% of others at the same level.
- The rating (Very Low, Relatively Low, Relatively Moderate, Relatively High, Very High) sorts all areas into five groups of similar values.
- The 18 hazards are avalanche, coastal flooding, cold wave, drought, earthquake, hail, heat wave, hurricane, ice storm, inland flooding, landslide, lightning, strong wind, tornado, tsunami, volcanic activity, wildfire and winter weather.
Terreflow’s Hazards tab maps FEMA’s census-tract ratings for wildfire, landslide, hurricane, tornado and coastal flooding. Flood zones there come from FEMA’s flood maps, and earthquake shaking from the USGS.
Same place, different answers
Harris County, Texas, home to Houston, has one of the highest overall ratings of any U.S. county. Its neighborhoods tell a different story:
| Area | Overall FEMA rating |
|---|---|
| Harris County, as a county | Very High (score 99.9 of 100) |
| Its 1,115 census tracts | 5 Very High · 226 Relatively High · 554 Relatively Moderate · 304 Relatively Low · 26 Very Low |
FEMA National Risk Index, December 2025 data, composite rating for all hazards.
Both are correct. A county adds up the expected losses of millions of people and buildings, so a large county ranks near the top of all counties; each tract is ranked only against other tracts. FEMA’s own FAQ explains that a high-rated county can be made of mostly low-rated tracts, and the reverse.
The risk of putting one number on risk
Any single risk score, from any source, packs many choices into one number. Before you trust it, it helps to know what can get lost:
- It blends different things. How often a hazard strikes, how much property is in the way, and who lives nearby all go into one figure. Two identical houses can rate differently because of their neighborhoods, not the hazard.
- Dollars drive it. Areas with more valuable or denser property stand to lose more, so they rank higher. A rural home in a hazard’s path can rank low simply because little is exposed around it.
- It’s relative. “Very Low” means low compared with everywhere else, not “won’t happen here.” Ranks also shift when other places change.
- It looks backward. It rests on past events and loss records, which FEMA treats as a lower-bound estimate because losses go unreported. New building, changing weather and better codes all move the future.
- Averages hide your lot. A tract of thousands of people spans high and low ground. A house’s elevation, drainage and construction aren’t in the number.
- It looks more precise than it is. A score like 87.4 suggests accuracy that nationwide data can’t give; FEMA notes that local data are often more accurate.
- Numbers change behavior. A low score can lull people into skipping insurance or preparation; a high one can steer buyers away from a sound house. Neither is the score’s fault if it is read for what it is.
How to use it well
- Compare places and see which hazards stand out in an area, using the rating for each hazard, not only the overall one.
- Then check the house itself: the FEMA flood zone, where water runs on the land (how to read a drainage map), the elevation, the roof and windows, defensible space in wildfire country, an inspection and real insurance quotes.
- Ask what’s inside any score you see: what data, what area, compared with what, how old, and whether you can check it yourself.
FEMA retired its own National Risk Index map application; the data (version 1.20, December 2025) is now published through FEMA’s Resilience Analysis and Planning Tool. See FEMA’s National Risk Index page and its FAQ (PDF) for the full method.
Check an address
FEMA’s hazard ratings next to the flood zone, surface drainage and elevation, on one 3D map.
Open the map →