Data
Flood insurance claims in the 50 largest U.S. cities, ranked
Which big U.S. cities file the most flood insurance claims? We counted every FEMA flood insurance claim since 1978 inside the city limits of the 50 largest cities, and divided by each city’s number of homes.
Houston has by far the most: 83.8 claims per 1,000 homes since 1978, nearly a third of them in 2017, the year of Hurricane Harvey. Next come Tampa (48.9), Virginia Beach (33.0) and Miami (30.4). San Francisco, Bakersfield and Mesa have the fewest.
A low rank doesn’t mean a city is safe! Only insured buildings file claims, and local runoff can still flood a house anywhere.
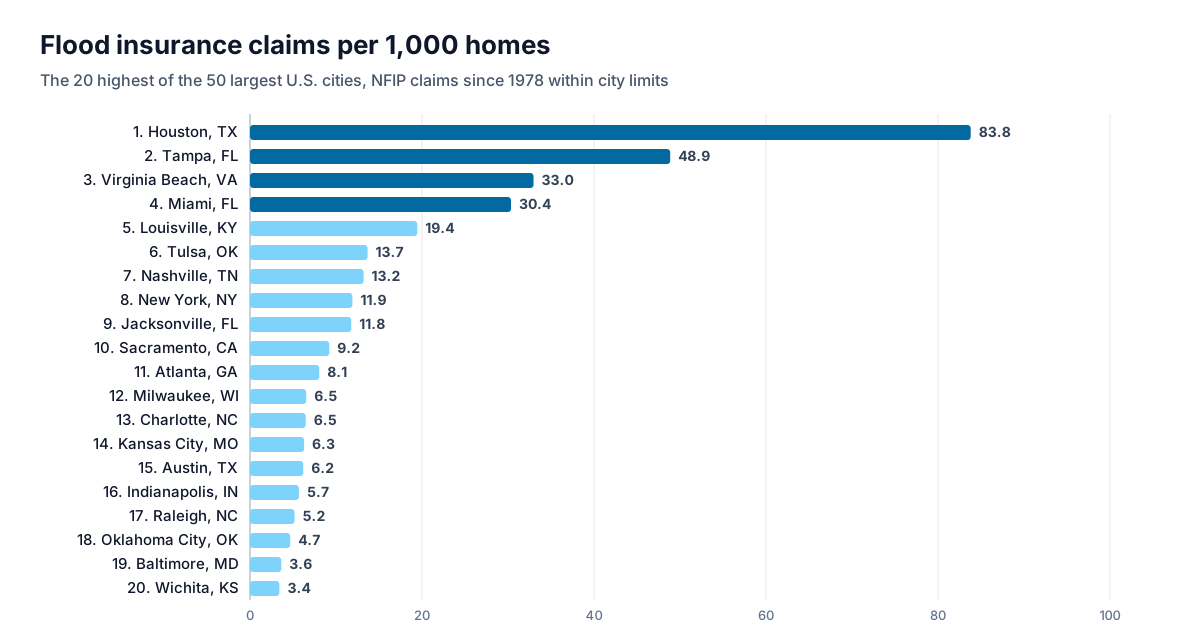
All 50 cities
Ranked by FEMA flood insurance claims per 1,000 homes, 1978 to 2026. Select a city for its flood and drainage map.
| # | City | Claims since 1978 | Per 1,000 homes | Biggest year (claims) |
|---|---|---|---|---|
| 1 | Houston, TX | 87,196 | 83.8 | 2017 · Hurricane Harvey (26,795) |
| 2 | Tampa, FL | 8,913 | 48.9 | 2024 · Hurricane Helene (4,722) |
| 3 | Virginia Beach, VA | 6,306 | 33.0 | 2016 · Hurricane Matthew (1,497) |
| 4 | Miami, FL | 6,792 | 30.4 | 1999 · Hurricane Irene (1,672) |
| 5 | Louisville, KY | 5,622 | 19.4 | 1997 (1,574) |
| 6 | Tulsa, OK | 2,636 | 13.7 | 1984 (1,576) |
| 7 | Nashville, TN | 4,554 | 13.2 | 2010 · Late spring storms (2,234) |
| 8 | New York, NY | 43,828 | 11.9 | 2012 · Hurricane Sandy (16,642) |
| 9 | Jacksonville, FL | 5,076 | 11.8 | 2017 · Hurricane Irma (1,959) |
| 10 | Sacramento, CA | 1,960 | 9.2 | 1995 (846) |
| 11 | Atlanta, GA | 2,143 | 8.1 | 2009 · Late summer storms (428) |
| 12 | Milwaukee, WI | 1,695 | 6.5 | 1998 (617) |
| 13 | Charlotte, NC | 2,588 | 6.5 | 2008 (411) |
| 14 | Kansas City, MO | 1,544 | 6.3 | 1982 (264) |
| 15 | Austin, TX | 2,996 | 6.2 | 2013 (523) |
| 16 | Indianapolis, IN | 2,285 | 5.7 | 2003 (391) |
| 17 | Raleigh, NC | 1,165 | 5.2 | 1996 · Hurricane Fran (317) |
| 18 | Oklahoma City, OK | 1,432 | 4.7 | 1993 (175) |
| 19 | Baltimore, MD | 1,073 | 3.6 | 2003 · Hurricane Isabel (175) |
| 20 | Wichita, KS | 603 | 3.4 | 1998 (74) |
| 21 | El Paso, TX | 726 | 2.7 | 2006 (246) |
| 22 | Los Angeles, CA | 4,020 | 2.6 | 1998 · Pineapple Express - Southern (711) |
| 23 | Colorado Springs, CO | 520 | 2.5 | 2013 · Late summer storms (119) |
| 24 | San Antonio, TX | 1,461 | 2.4 | 1998 (261) |
| 25 | Dallas, TX | 1,356 | 2.3 | 1991 (157) |
| 26 | Philadelphia, PA | 1,549 | 2.1 | 2020 · Hurricane Isaias (251) |
| 27 | Phoenix, AZ | 1,312 | 2.0 | 1990 (139) |
| 28 | Long Beach, CA | 357 | 2.0 | 1995 (53) |
| 29 | San Jose, CA | 667 | 1.9 | 2017 (157) |
| 30 | Memphis, TN | 547 | 1.9 | 2014 (78) |
| 31 | Fort Worth, TX | 675 | 1.8 | 1990 (62) |
| 32 | Detroit, MI | 570 | 1.7 | 2021 (121) |
| 33 | San Diego, CA | 887 | 1.6 | 2024 · San Diego Flooding (137) |
| 34 | Columbus, OH | 620 | 1.5 | 1979 (129) |
| 35 | Omaha, NE | 312 | 1.5 | 2019 · March 2019 Midwest Flooding (49) |
| 36 | Oakland, CA | 256 | 1.3 | 1982 (68) |
| 37 | Washington, DC | 466 | 1.3 | 2020 (63) |
| 38 | Boston, MA | 346 | 1.1 | 2018 (41) |
| 39 | Tucson, AZ | 208 | 0.8 | 1983 (32) |
| 40 | Portland, OR | 249 | 0.8 | 1996 (98) |
| 41 | Las Vegas, NV | 210 | 0.8 | 1984 (41) |
| 42 | Minneapolis, MN | 160 | 0.8 | 1987 (41) |
| 43 | Fresno, CA | 144 | 0.8 | 1995 (36) |
| 44 | Chicago, IL | 894 | 0.7 | 2013 · Mid-spring storms (121) |
| 45 | Seattle, WA | 274 | 0.7 | 2007 · Winter storm (26) |
| 46 | Denver, CO | 240 | 0.7 | 2015 (47) |
| 47 | Albuquerque, NM | 120 | 0.5 | 1980 (22) |
| 48 | Mesa, AZ | 64 | 0.3 | 2014 (10) |
| 49 | Bakersfield, CA | 36 | 0.3 | 1998 (7) |
| 50 | San Francisco, CA | 19 | 0.1 | 2019 (5) |
Download the data: the 50 cities (CSV). Free to reuse under CC BY 4.0 with credit to Terreflow; FEMA’s own data is public domain.
How we counted
- Claims: every National Flood Insurance Program claim in FEMA’s public record (OpenFEMA, data as of September 8, 2026) rated in the city’s own NFIP community, which covers the city limits, wherever the city spans several counties.
- Homes: housing units in the city, from the Census Bureau’s American Community Survey (2020–2024).
- The 50 cities: the largest incorporated U.S. cities by population in the same survey.
What the ranking doesn’t show
- Uninsured flooding. Only buildings with flood insurance can file a claim, and few owners outside high-risk zones buy it, so cities with little coverage can look drier than they are.
- Any one house. A city’s rate says nothing about a particular address. Check the flood zone and the terrain around it, and ask about its flood history.
- Today’s risk. Claims since 1978 reflect past storms, past insurance and past city limits; homes are counted today.
See where water goes around an address
Terreflow maps the terrain drainage around any U.S. address next to its FEMA flood zone: where rain runs, where it collects, and whether the lot is in its path.
Analyze an address →Sources
- FEMA, OpenFEMA: NFIP Redacted Claims (v3), data as of September 8, 2026
- U.S. Census Bureau, American Community Survey 2020–2024 5-year estimates, tables B01003 (population) and B25001 (housing units), by place
- U.S. Census Bureau, 2024 Gazetteer files (place names)