Sun & solar
How much sun does my property get?
Sunlight varies about twofold across the United States, and a slope can add or take away another tenth. Here’s how to read the numbers for one property.
Open the address on Terreflow’s Solar tab. It shows the long-term average sunlight for that spot (GHI, in kWh per square meter per day, the same as peak sun hours), and shades the map so south-facing slopes read higher and north-facing ones lower. Across the lower 48 the average runs from about 3 in the cloudy Pacific Northwest to over 6 in the desert Southwest; the middle is about 4.5. Trees, buildings and roof direction aren’t in the data, so check those on site.
What the number means
GHI (global horizontal irradiance) is all the sunlight, direct and diffuse, that reaches flat ground. One kWh per square meter per day equals one peak sun hour, an hour of full sun at 1,000 watts per square meter, so a GHI of 4.8 means about 4.8 peak sun hours a day over the year.
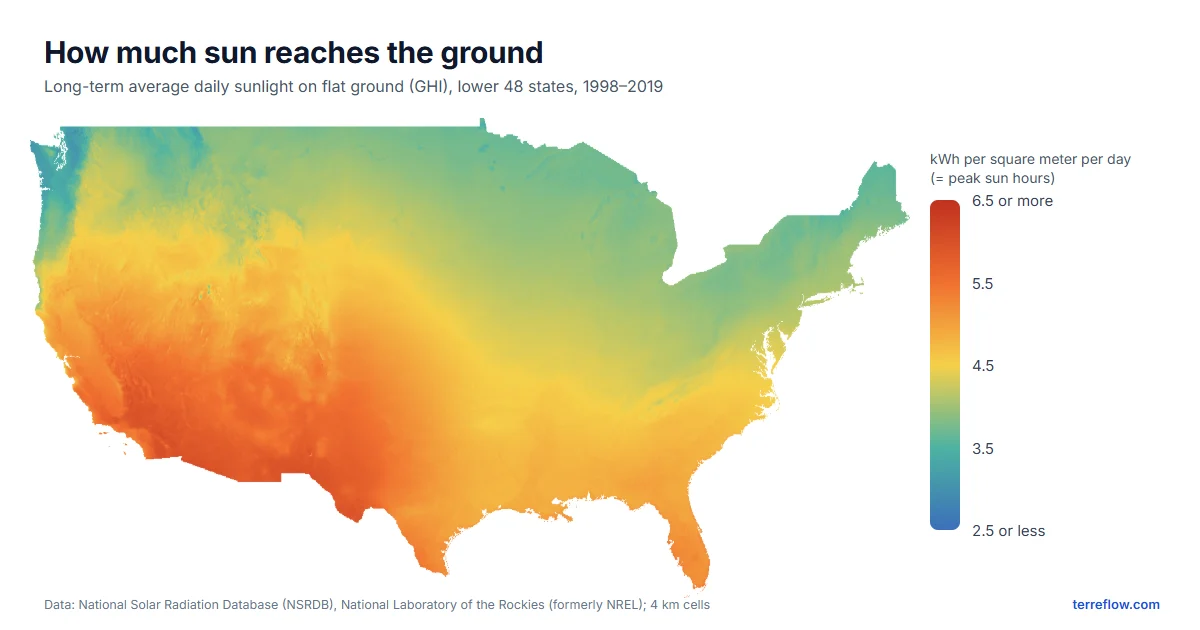
- Above 5.5: the desert Southwest, inland southern California and far West Texas.
- 4.5 to 5.5: most of the South, the southern Plains and the Mountain West.
- 3.5 to 4.5: the Midwest, the Great Lakes and the Northeast.
- About 3.5 and below: western Washington and Oregon, where winter clouds cut the year’s total.
The numbers come from the National Solar Radiation Database (NSRDB) of the U.S. Department of Energy’s National Laboratory of the Rockies (formerly NREL), averaged over 1998–2019 in cells about 4 km (2.5 miles) across.
How slope changes it
Ground that tilts toward the sun catches more light than flat ground; ground that tilts away catches less. Over a year, at 35° north (Charlotte, Nashville, Albuquerque):
| Slope | Facing south | East or west | Facing north |
|---|---|---|---|
| 5° | +3% | 0% | −4% |
| 10° | +6% | 0% | −8% |
| 20° | +10% | −2% | −17% |
| 30° | +11% | −4% | −28% |
Estimates from the standard isotropic-sky model (Liu & Jordan; Duffie & Beckman, Solar Engineering of Thermal Processes), the same model that shades the Solar tab. Farther north the effect grows: at 45° north, a 20° north-facing slope gets about a fifth less sun.
The same model gives the familiar rule for solar panels: a fixed panel tilted at your latitude and facing south collects about 8% more than a flat one in South Texas, about 11% around 35° north and 15–19% across the northern states. For a real system estimate, use the free PVWatts calculator with your roof’s tilt and direction.
Sunlight in the 50 largest cities
Average daily sunlight across each city’s map area. Click a city for its flood and drainage map, where the Solar tab shows any address.
See all 50 cities, sunniest first
| # | City | Sunlight, kWh/m² per day |
|---|---|---|
| 1 | El Paso, TX | 6.0 |
| 2 | Tucson, AZ | 5.8 |
| 3 | Phoenix, AZ | 5.8 |
| 4 | Mesa, AZ | 5.8 |
| 5 | San Diego, CA | 5.7 |
| 6 | Las Vegas, NV | 5.6 |
| 7 | Albuquerque, NM | 5.6 |
| 8 | Bakersfield, CA | 5.5 |
| 9 | Los Angeles, CA | 5.5 |
| 10 | Fresno, CA | 5.4 |
| 11 | Long Beach, CA | 5.3 |
| 12 | San Jose, CA | 5.3 |
| 13 | Miami, FL | 5.2 |
| 14 | Tampa, FL | 5.2 |
| 15 | Sacramento, CA | 5.2 |
| 16 | San Antonio, TX | 5.0 |
| 17 | Austin, TX | 5.0 |
| 18 | Oakland, CA | 5.0 |
| 19 | Colorado Springs, CO | 5.0 |
| 20 | Fort Worth, TX | 5.0 |
| 21 | Jacksonville, FL | 4.9 |
| 22 | San Francisco, CA | 4.9 |
| 23 | Dallas, TX | 4.9 |
| 24 | Houston, TX | 4.9 |
| 25 | Oklahoma City, OK | 4.8 |
| 26 | Denver, CO | 4.8 |
| 27 | Wichita, KS | 4.7 |
| 28 | Atlanta, GA | 4.7 |
| 29 | Charlotte, NC | 4.7 |
| 30 | Tulsa, OK | 4.6 |
| 31 | Raleigh, NC | 4.6 |
| 32 | Memphis, TN | 4.6 |
| 33 | Virginia Beach, VA | 4.5 |
| 34 | Nashville, TN | 4.4 |
| 35 | Kansas City, MO | 4.4 |
| 36 | Omaha, NE | 4.3 |
| 37 | Louisville, KY | 4.3 |
| 38 | Washington, DC | 4.3 |
| 39 | Baltimore, MD | 4.2 |
| 40 | Indianapolis, IN | 4.2 |
| 41 | Philadelphia, PA | 4.1 |
| 42 | New York, NY | 4.1 |
| 43 | Columbus, OH | 4.1 |
| 44 | Chicago, IL | 4.0 |
| 45 | Boston, MA | 4.0 |
| 46 | Milwaukee, WI | 4.0 |
| 47 | Detroit, MI | 4.0 |
| 48 | Minneapolis, MN | 3.9 |
| 49 | Portland, OR | 3.5 |
| 50 | Seattle, WA | 3.4 |
What the map can’t see
- Shade. Trees, buildings and nearby ridges that block the sun aren’t in the data. On a wooded lot they can matter more than anything on this page.
- Your roof. The numbers are for the ground. A roof’s own pitch and direction decide what panels on it receive.
- Very small places. Each sunlight cell is about 4 km across, and the slope shading follows the terrain the map has loaded, so one yard or a small knoll may not show.
- Any single year. These are long-term averages; one year can be several percent sunnier or cloudier.
The same map’s Soil tab shows what’s under the ground: see what soil type is my property?
Check an address
Average sunlight with slope shading, soil type, surface drainage and the FEMA flood zone, on one 3D map.
Open the map →