San Diego, CA Flood Zone & Drainage Map

Address
Overview

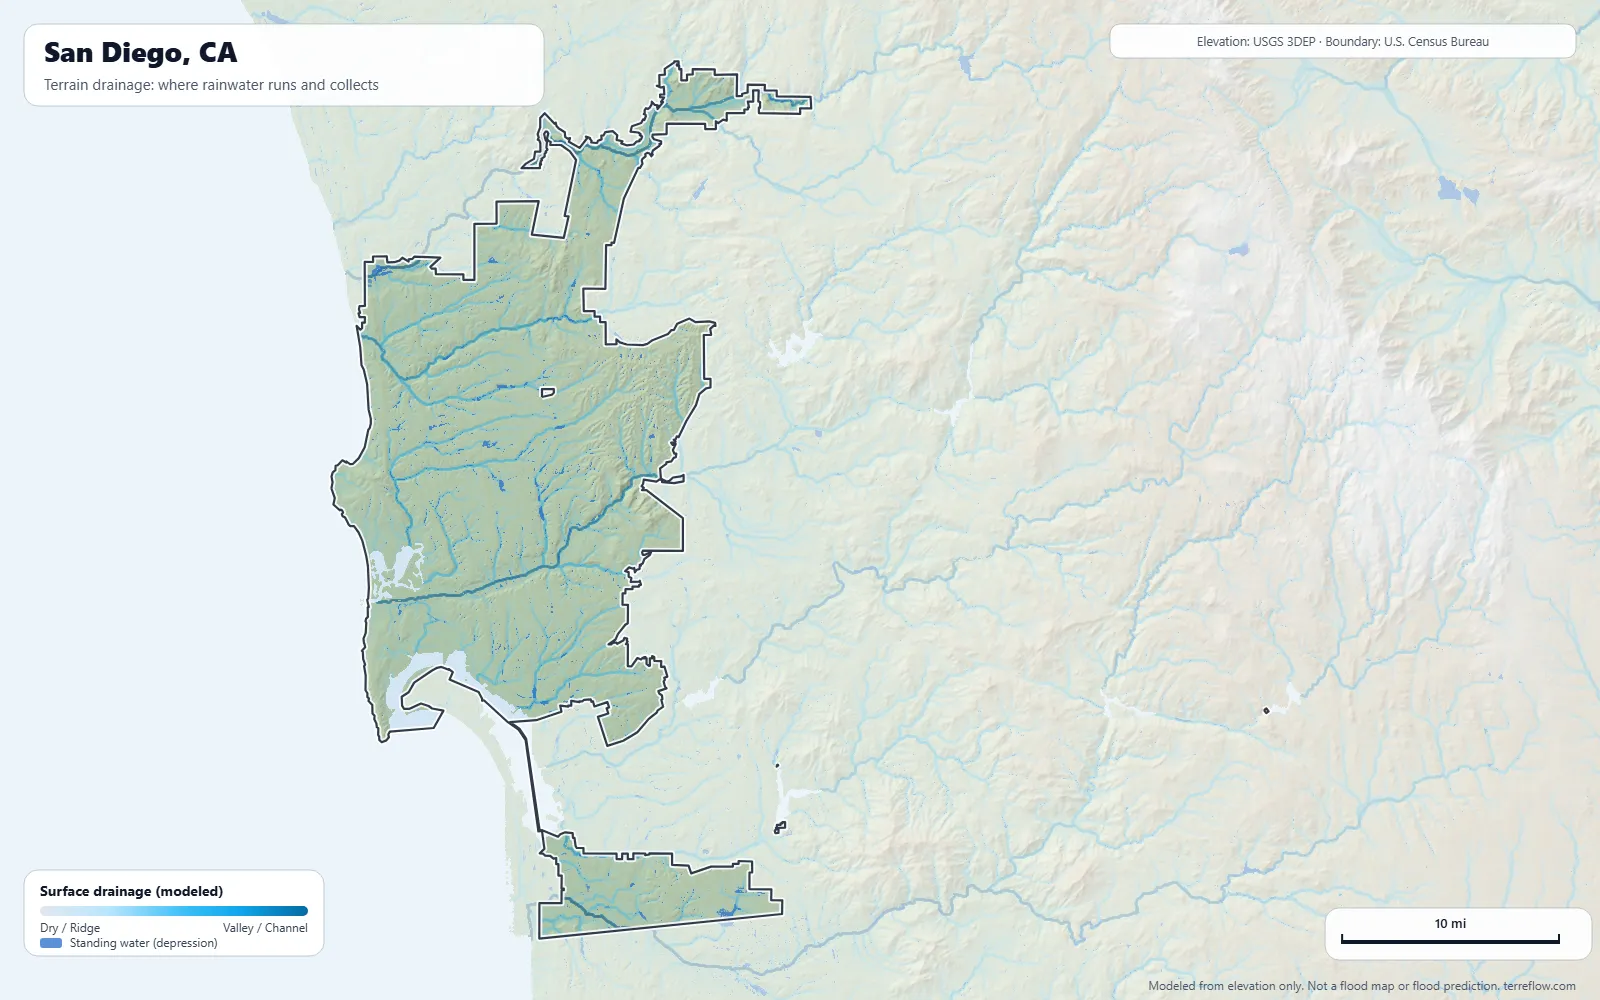
Where does rainwater drain in San Diego? This interactive map shows surface drainage patterns across San Diego, California, based on terrain shape: where gravity directs rainwater based on elevation and slope. For official flood risk information, see the FEMA flood zone layer on the Hazards tab.

For a San Diego property, compare terrain-based drainage with the separate FEMA flood zone layer. FEMA records 887 flood insurance claims in San Diego since 1978, the most in 2024 (San Diego Flooding). Inside city limits the ground ranges from about 5 to 1,038 feet above sea level (USGS 3DEP). Terrain flow lines are not a record of past flooding at a house or a prediction of stormwater depth. Choose a location to see surface drainage analysis and water flow direction based on terrain shape. The first three locations are free.

Interpretation

Select a location on the map or enter an address to see terrain analysis.

3D Terrain Visualization
Where does rainwater flow based on terrain shape? Blue areas show where water collects and drains downhill.
Units
Report a problem
—
Terrain drainage map of San Diego, CA: modeled paths where rainwater runs and collects, from USGS 3DEP elevation data, with the city boundary Click any spot on the map to analyze it
4.0× Horizontal:Vertical
Elevation loading...

San Diego flood history

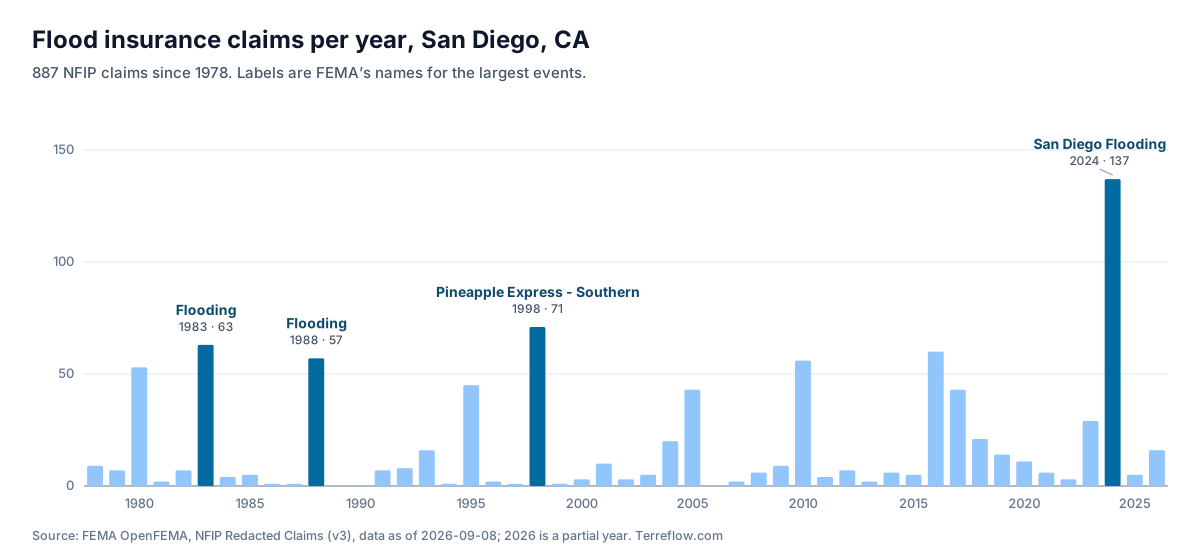
FEMA records 887 flood insurance claims in San Diego since 1978. 56% of the claims with a rated flood zone came from moderate- or low-risk zones (X, B or C), outside the high-risk areas on FEMA’s flood maps.

Among the 50 largest U.S. cities, San Diego ranks #33 for FEMA flood insurance claims per home: 1.6 claims per 1,000 homes since 1978 (887 claims within city limits). See all 50 citiesA low rank doesn’t mean San Diego is safe! Only insured buildings file claims, and local runoff can still flood a house here.

Bar chart of FEMA flood insurance claims per year in San Diego, CA, 1978 to 2026, highest in 2024 (San Diego Flooding) with 137 claims.

Biggest flood years

  1. 2024 · San Diego Flooding · 137 claims
  2. 1998 · Pineapple Express - Southern · 71 claims
  3. 1983 · Flooding · 63 claims
  4. 2016 · 60 claims
  5. 1988 · Flooding · 57 claims

ZIP codes with the most claims

ZIPClaimsShare
9210913014.7%
9211312414.0%
920379310.5%
92121586.5%
92120576.4%
92108525.9%
92107475.3%
92110445.0%

How to read this. These are National Flood Insurance Program claims, so they count only insured buildings and miss flooding where owners had no flood insurance. FEMA publishes them without names or addresses: they show which years and areas flooded, never whether a particular house did. They are the claims rated in the city’s own NFIP community, which covers the city limits. ZIP codes are as reported on the claims, and a ZIP code can extend beyond the city. The “rated” flood zone is the one used to price the policy and may come from an older map. Data as of 2026-09-08, from FEMA OpenFEMA.

Sunlight and soil in San Diego

Sunlight. Ground here gets about 5.7 kWh of sunlight per square meter per day on average (5.0 to 6.2 across the map), above the middle of the lower 48 (4.5). South-facing slopes get more, north-facing ones less.

Soil. The ground is mostly loamy soil (Regosols 49%, Cambisols 8%, Kastanozems 5%), with loamy soil over a clay-rich subsoil (Luvisols 32%). Rain soaks in at a moderate rate.

Sunlight: long-term average on flat ground from the National Solar Radiation Database (National Laboratory of the Rockies, formerly NREL). Soil: most likely soil types from ISRIC SoilGrids, a 250 m model, not a survey of any lot. Both cover the map area above.

Explore more flood and drainage maps

Browse all 64 flood and drainage maps · Flood insurance claims in the 50 largest cities · How Terreflow uses terrain and FEMA data