Elevation tab
Colors show height above sea level. Green = low ground, tan/brown = mid elevation, white = peaks. The color scale adapts to the area you're viewing.
Contour lines connect points of equal elevation. Closely packed lines = steep slope. Widely spaced = gentle or flat terrain.
Why it matters: Elevation tells you where water naturally drains — and where it collects.
Hydro tab
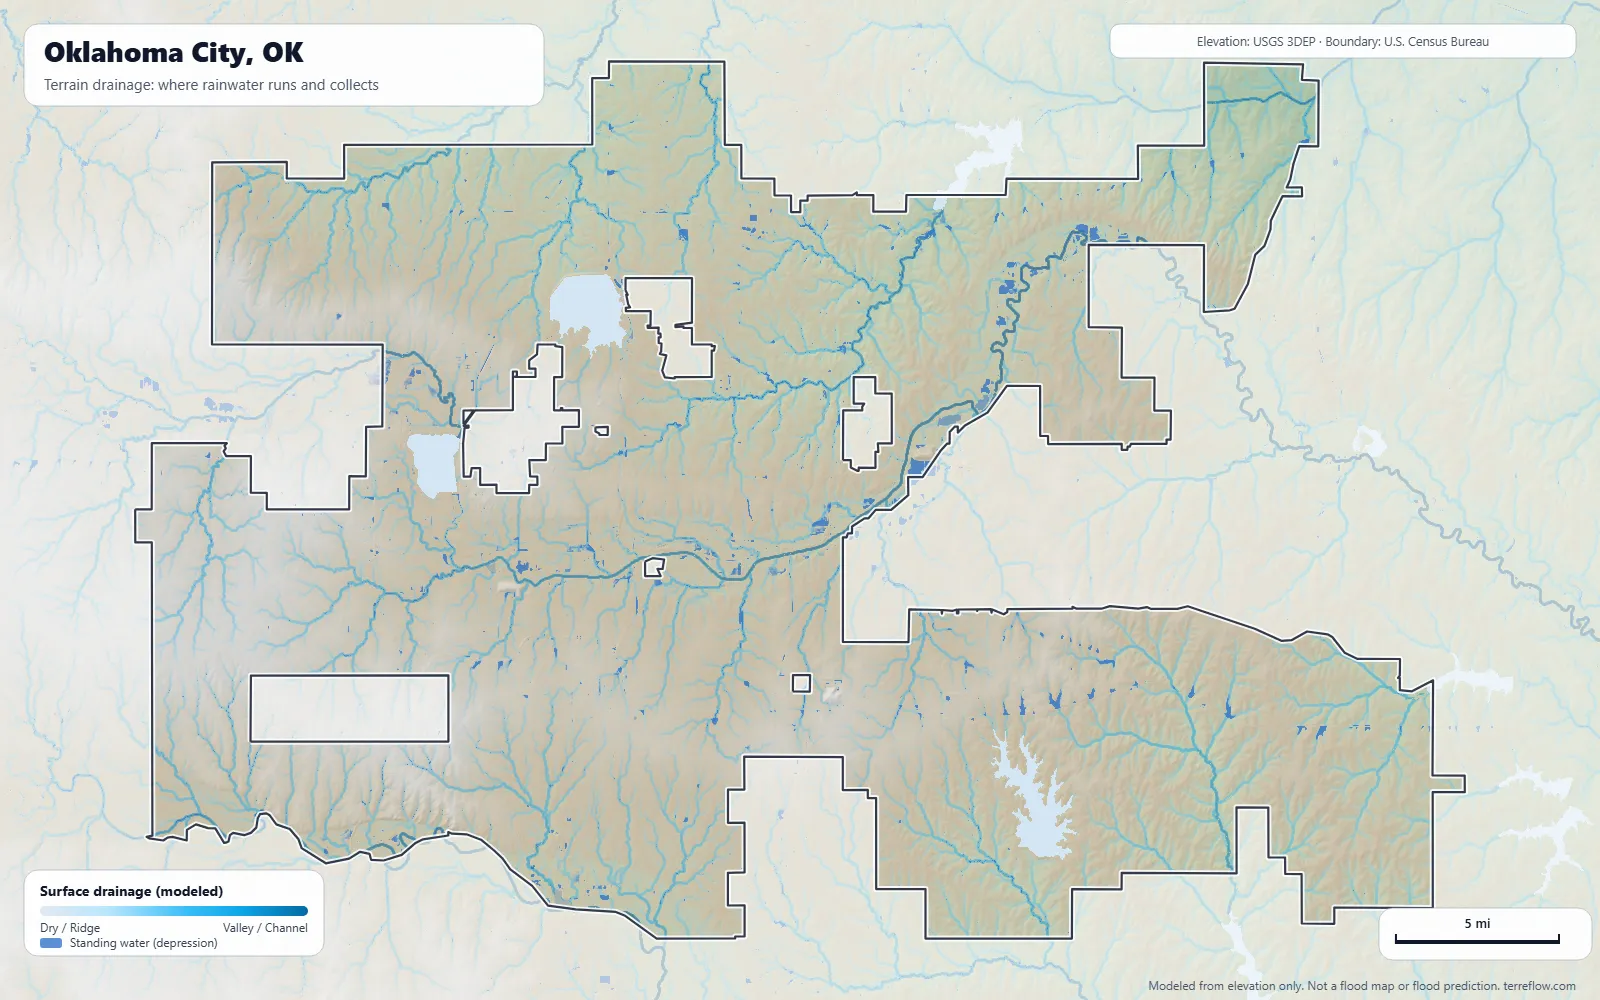
Shows where water goes when it rains. Deep blue areas are valley bottoms and stream channels. Light gray/white areas are ridges and high ground.
The moving dots simulate water particles following the terrain downhill.
Why it matters: A valley-bottom lot means all the rainwater from surrounding hills eventually passes through your land.
Solar tab
Colors show the long-term average sunlight on flat ground (GHI, kWh/m² per day, the same as peak sun hours) from the National Solar Radiation Database. Zoomed in, south-facing slopes read higher and north-facing ones lower.
US ranges: Southwest 5.5–6.5, Southeast/Midwest 4.5–5.5, Pacific NW/New England 3–4.
Hazards tab
Flood
Official FEMA flood zones. Zone AE/A: high risk (100-year flood). Zone X shaded: moderate. Zone X unshaded: minimal. Zone V/VE: coastal wave action.
Seismic
Ground shaking hazard from USGS. The Ss value is ground acceleration as a fraction of gravity.
Fault lines
Mapped fault traces from the USGS Quaternary Fault Database.
Fire
Wildfire Hazard Potential from USFS — structural risk based on fuel load and fire weather.
Soil tab
Colors show the most likely soil type from ISRIC SoilGrids; the legend lists the types in view. Select a location for its clay %, pH and organic carbon. Clay soaks up rain slowly, so more of it runs off; sand drains fast.
Controls
Address box: accepts addresses, place names, lon,lat pairs, or Mercator coordinates.
ft/m: unit toggle. Contours: on/off. Exaggeration slider: vertical stretch.
 Click any spot on the map to analyze it